Welcome to Part 2!
# Homework review
Your favorite interactive stories
Mapping Record-High Heat in U.S. Cities | The Pudding
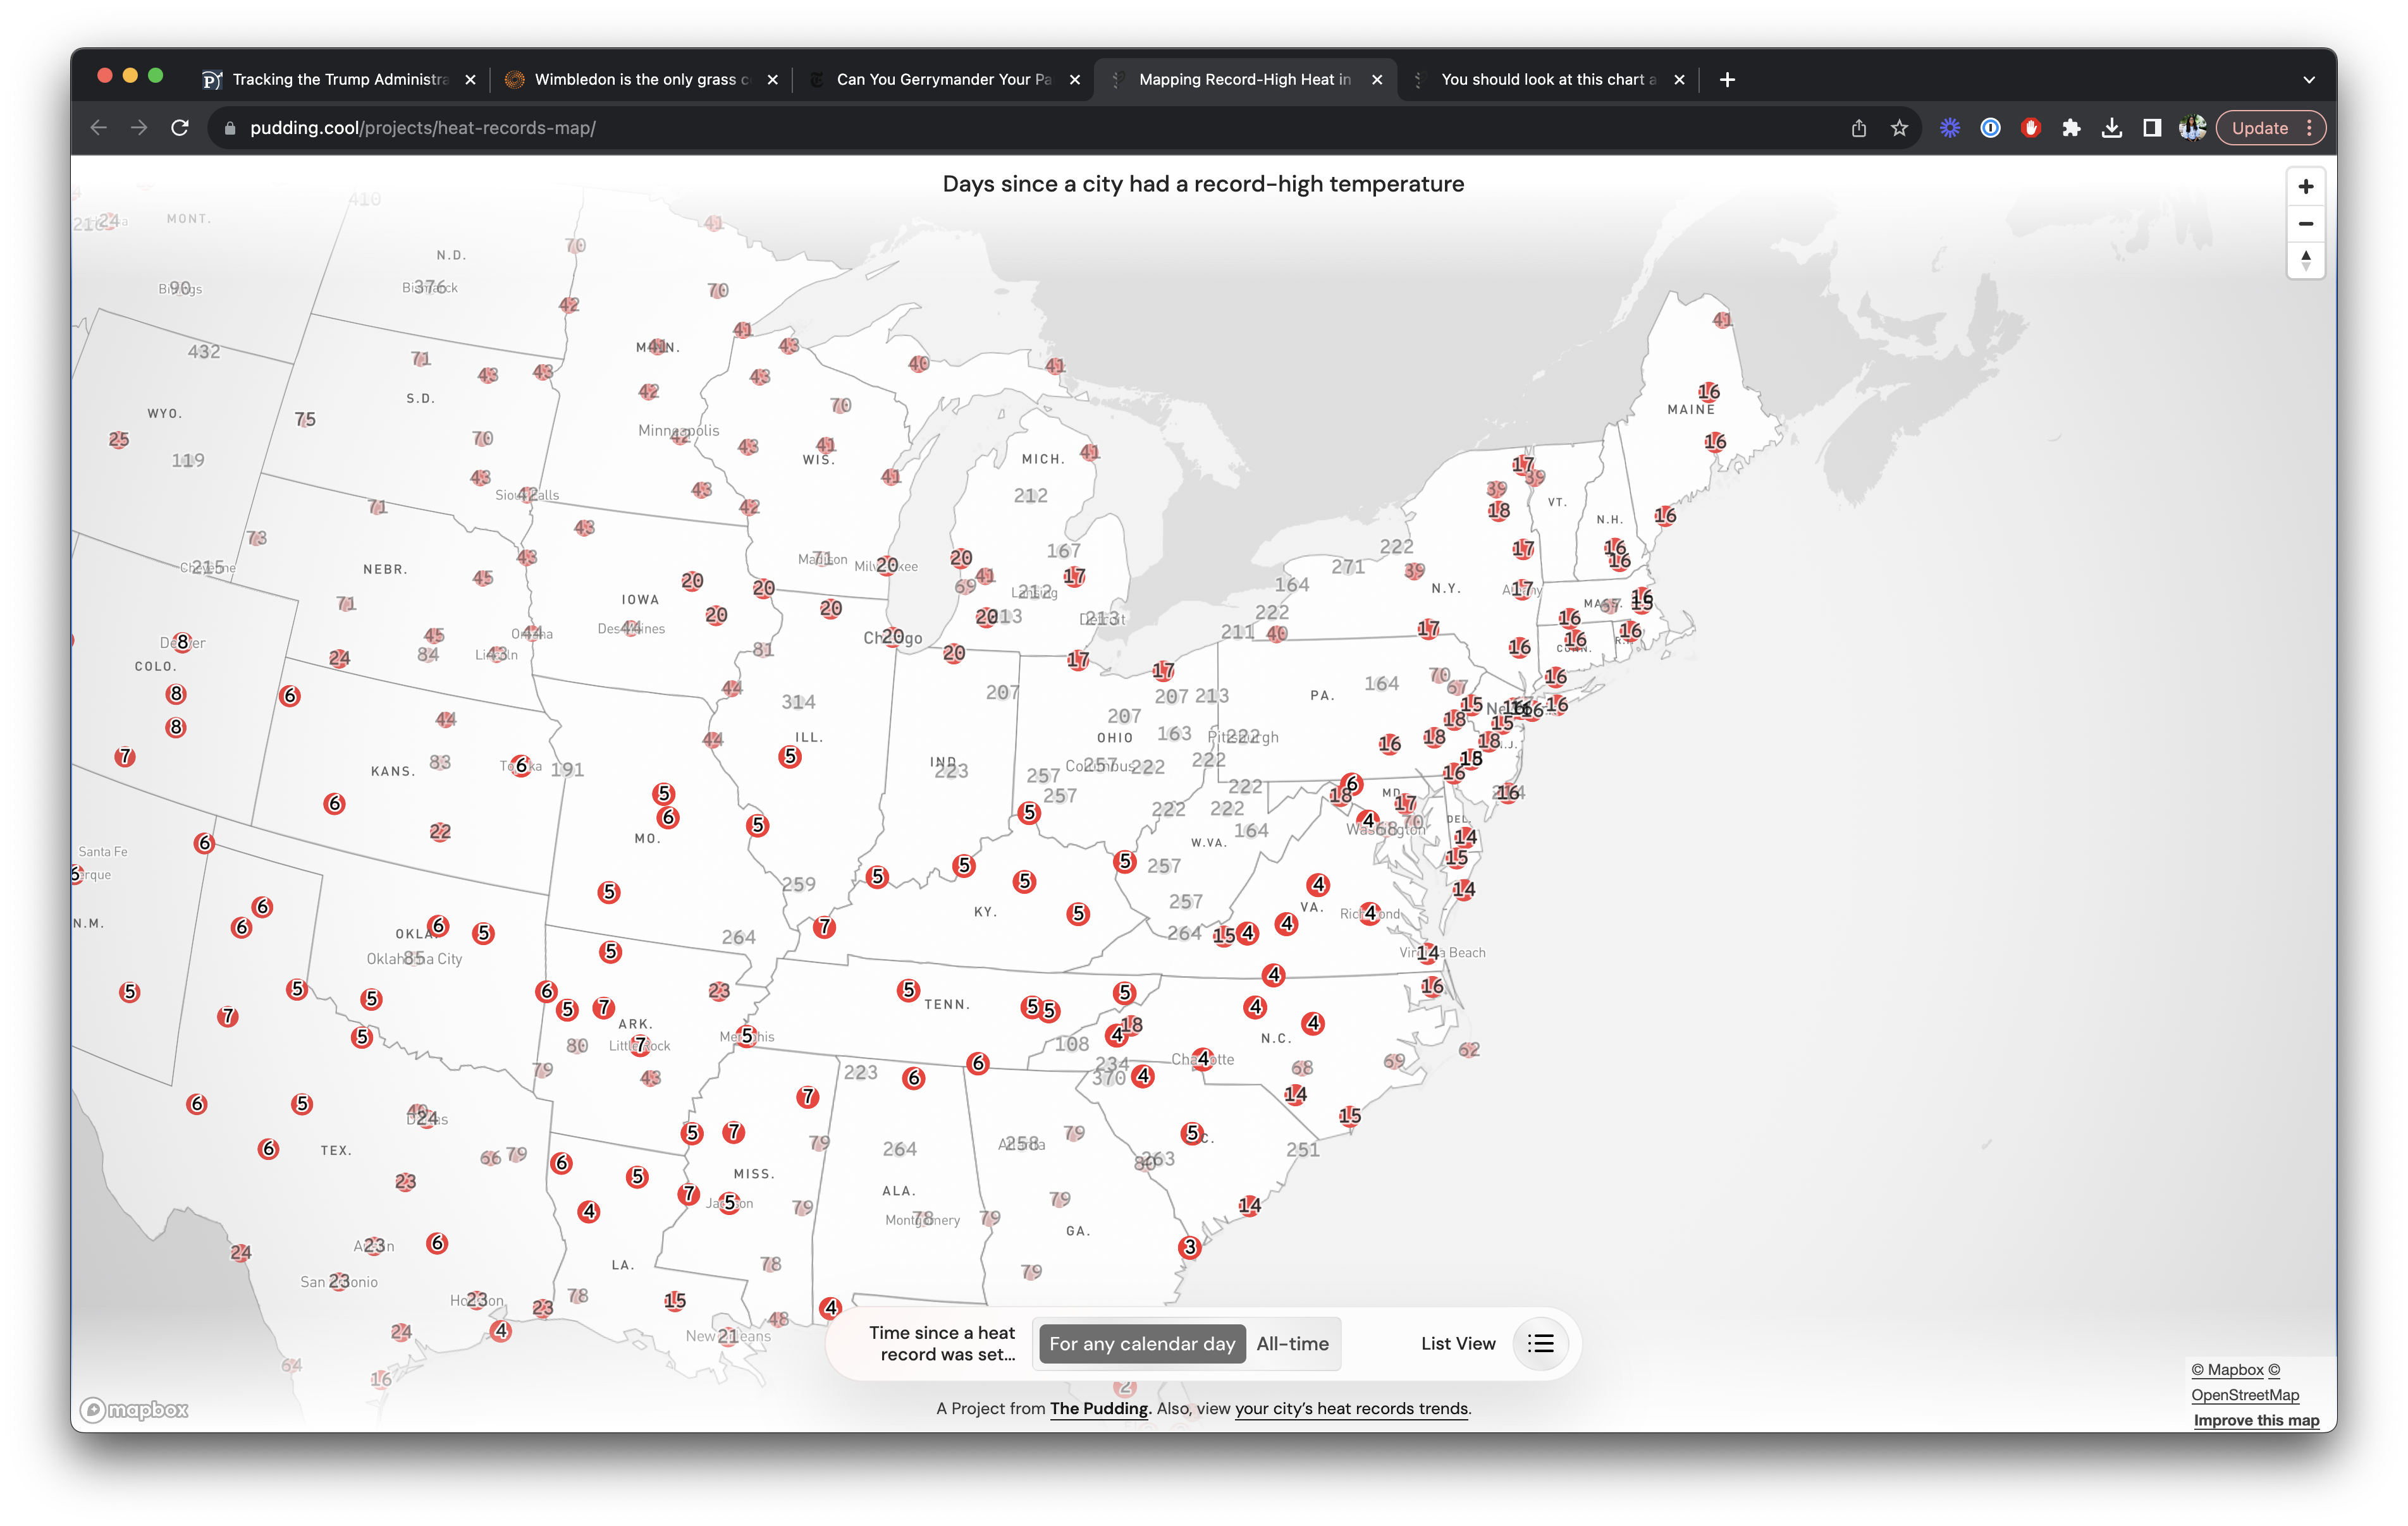
- Dailon
Tracking the Trump Administration’s “Midnight Regulations” | ProPublica
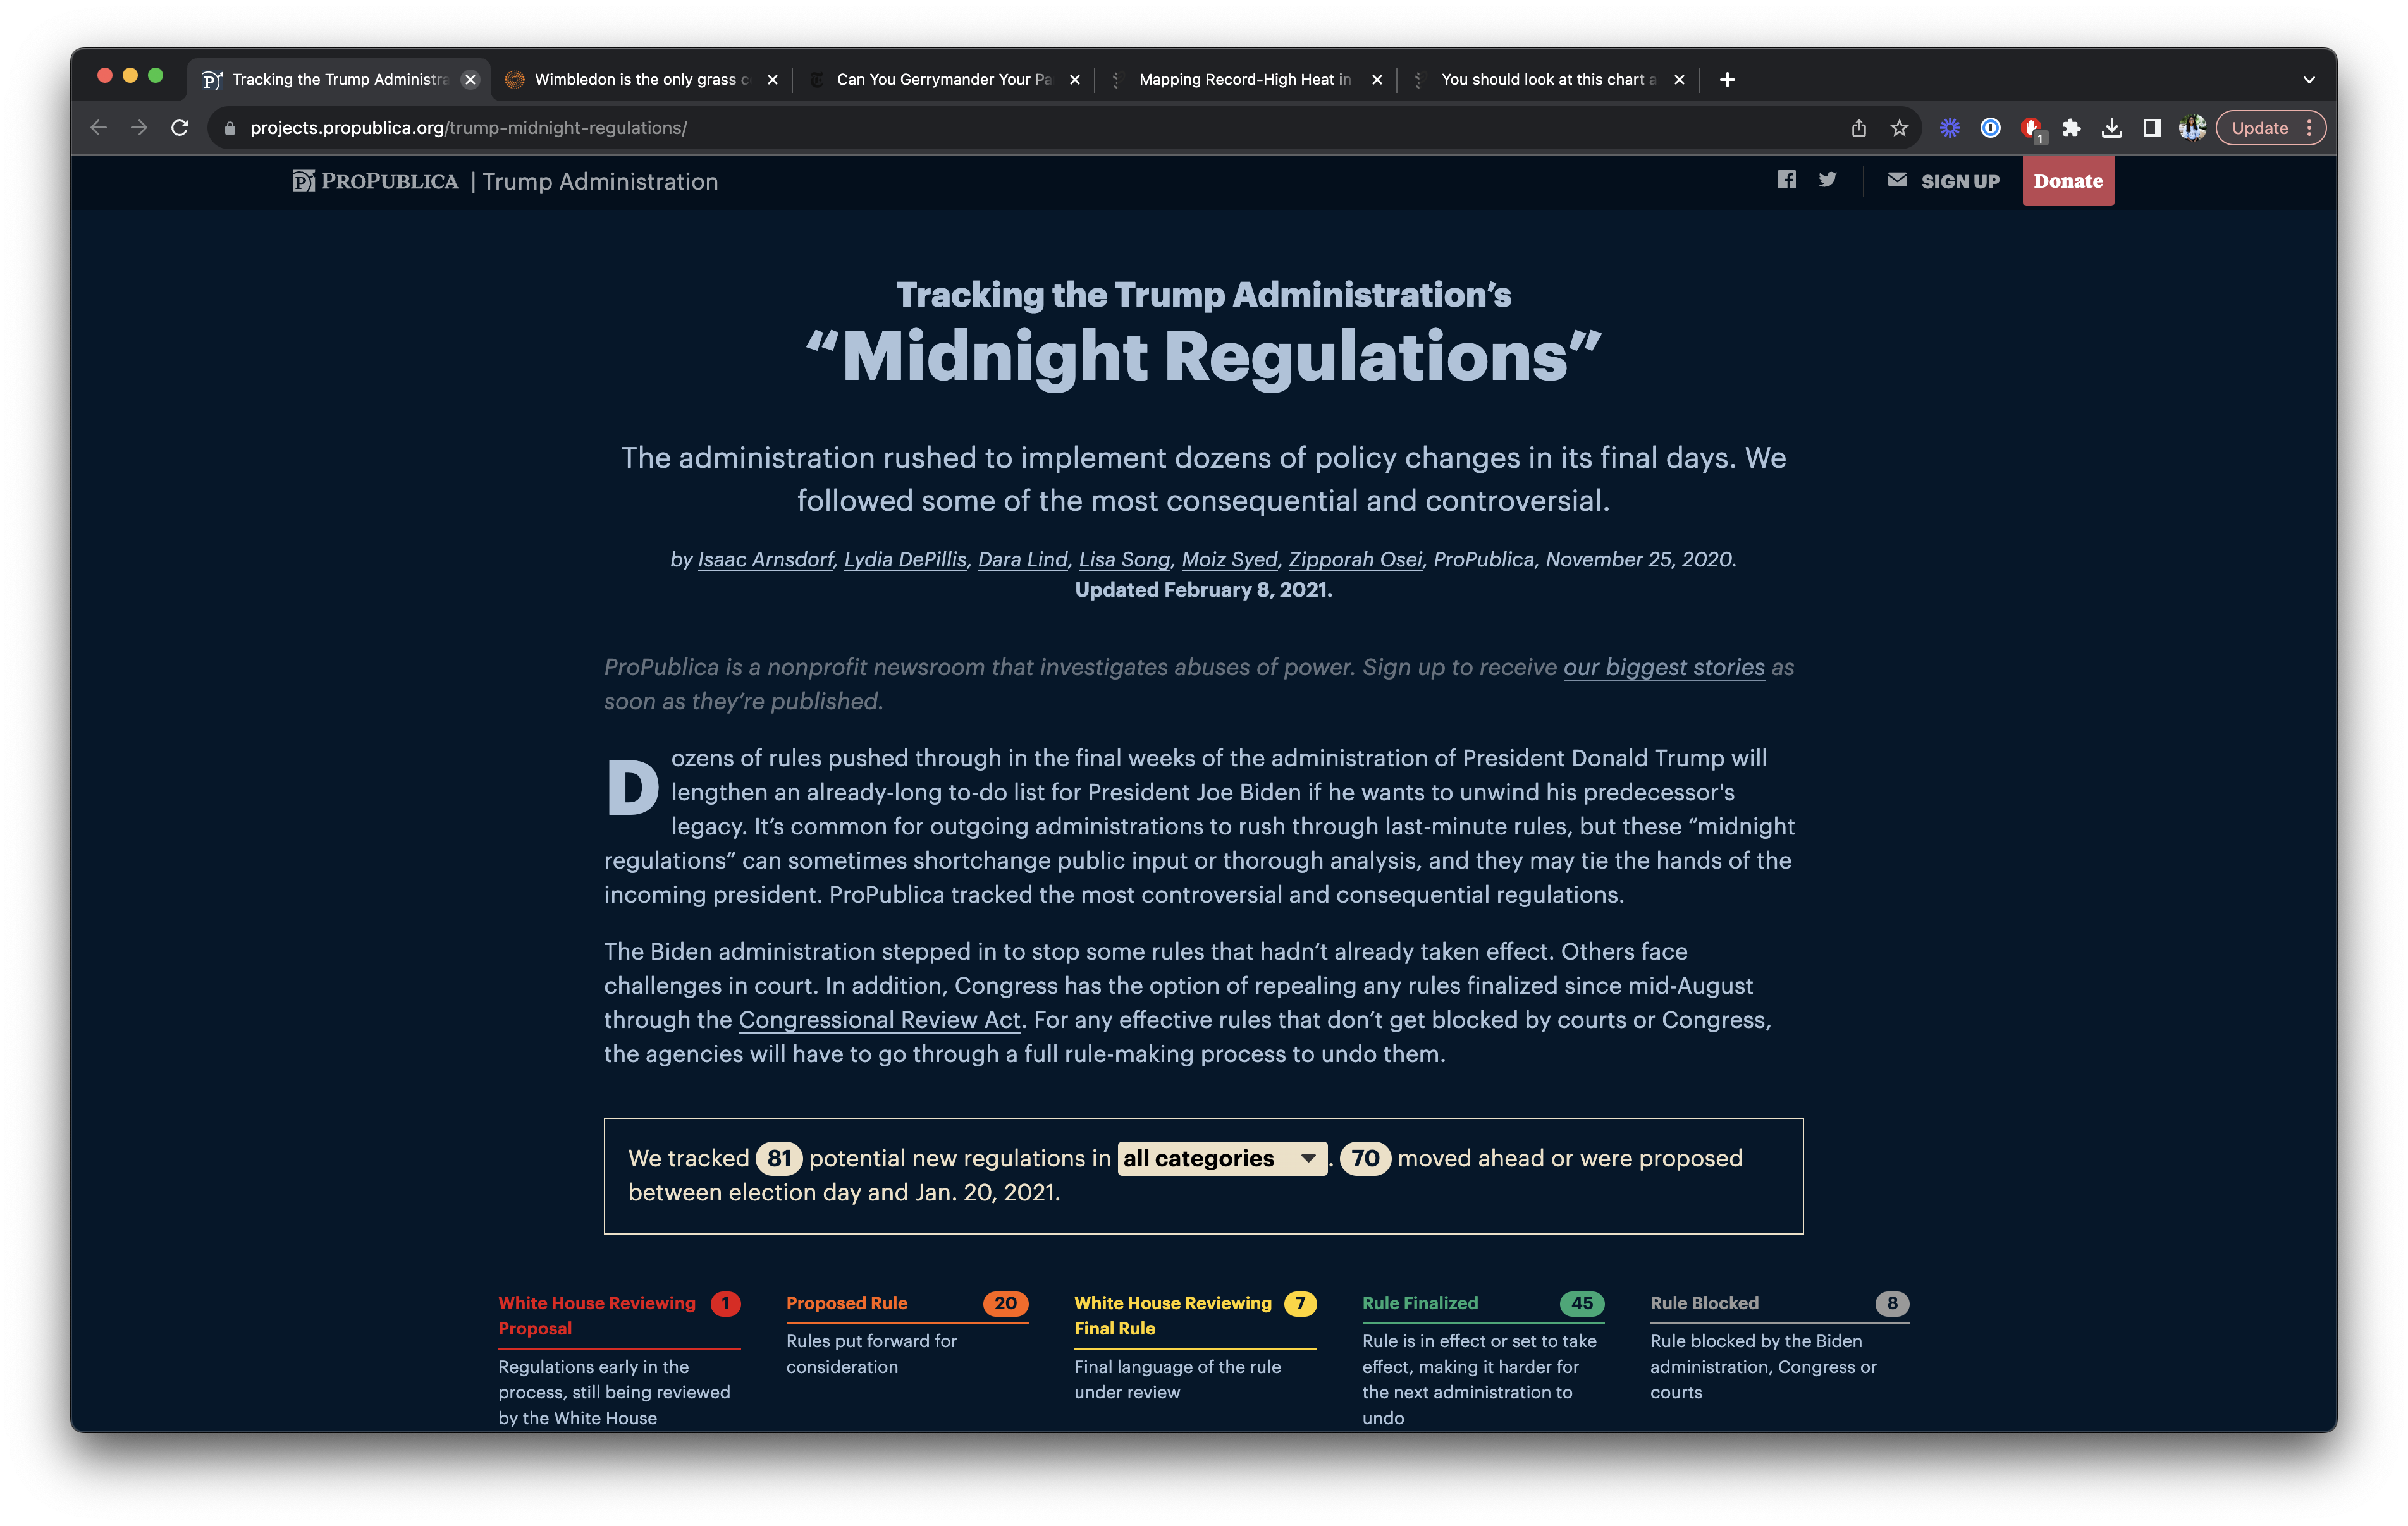
- Cameron
The grass courts are now in session | Reuters
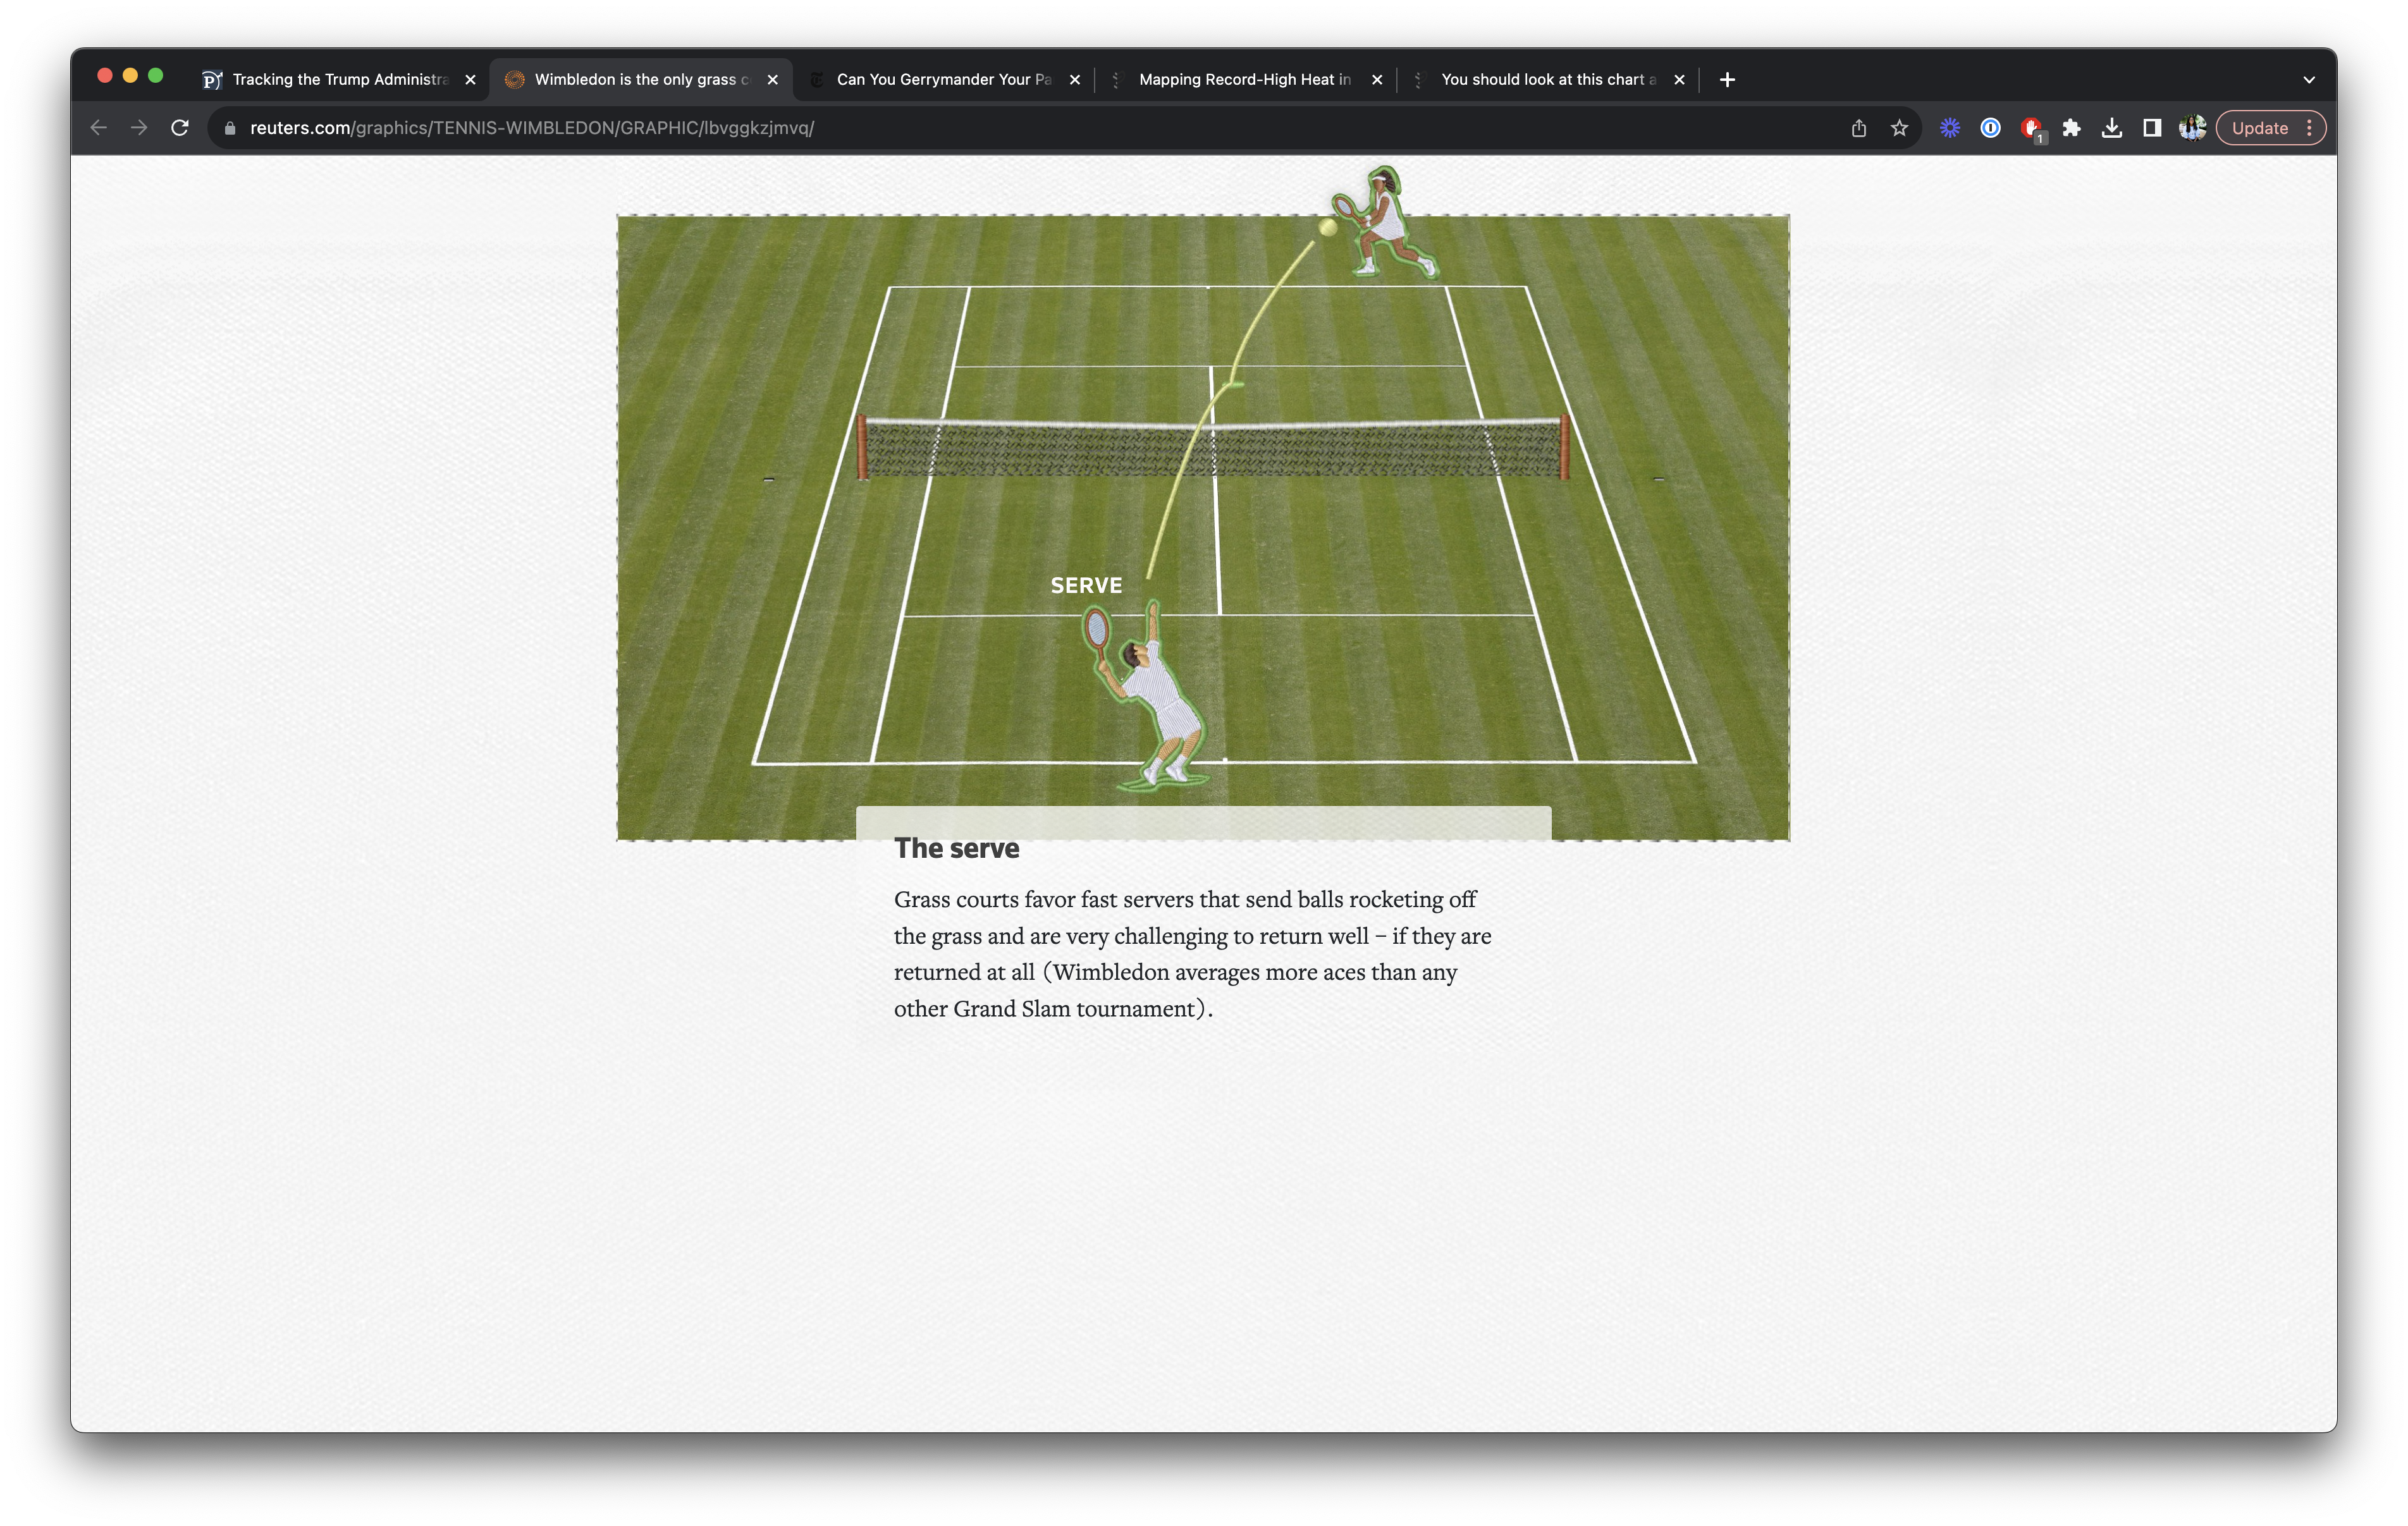
- Scarlett
Can You Gerrymander Your Party to Power? | The New York Times
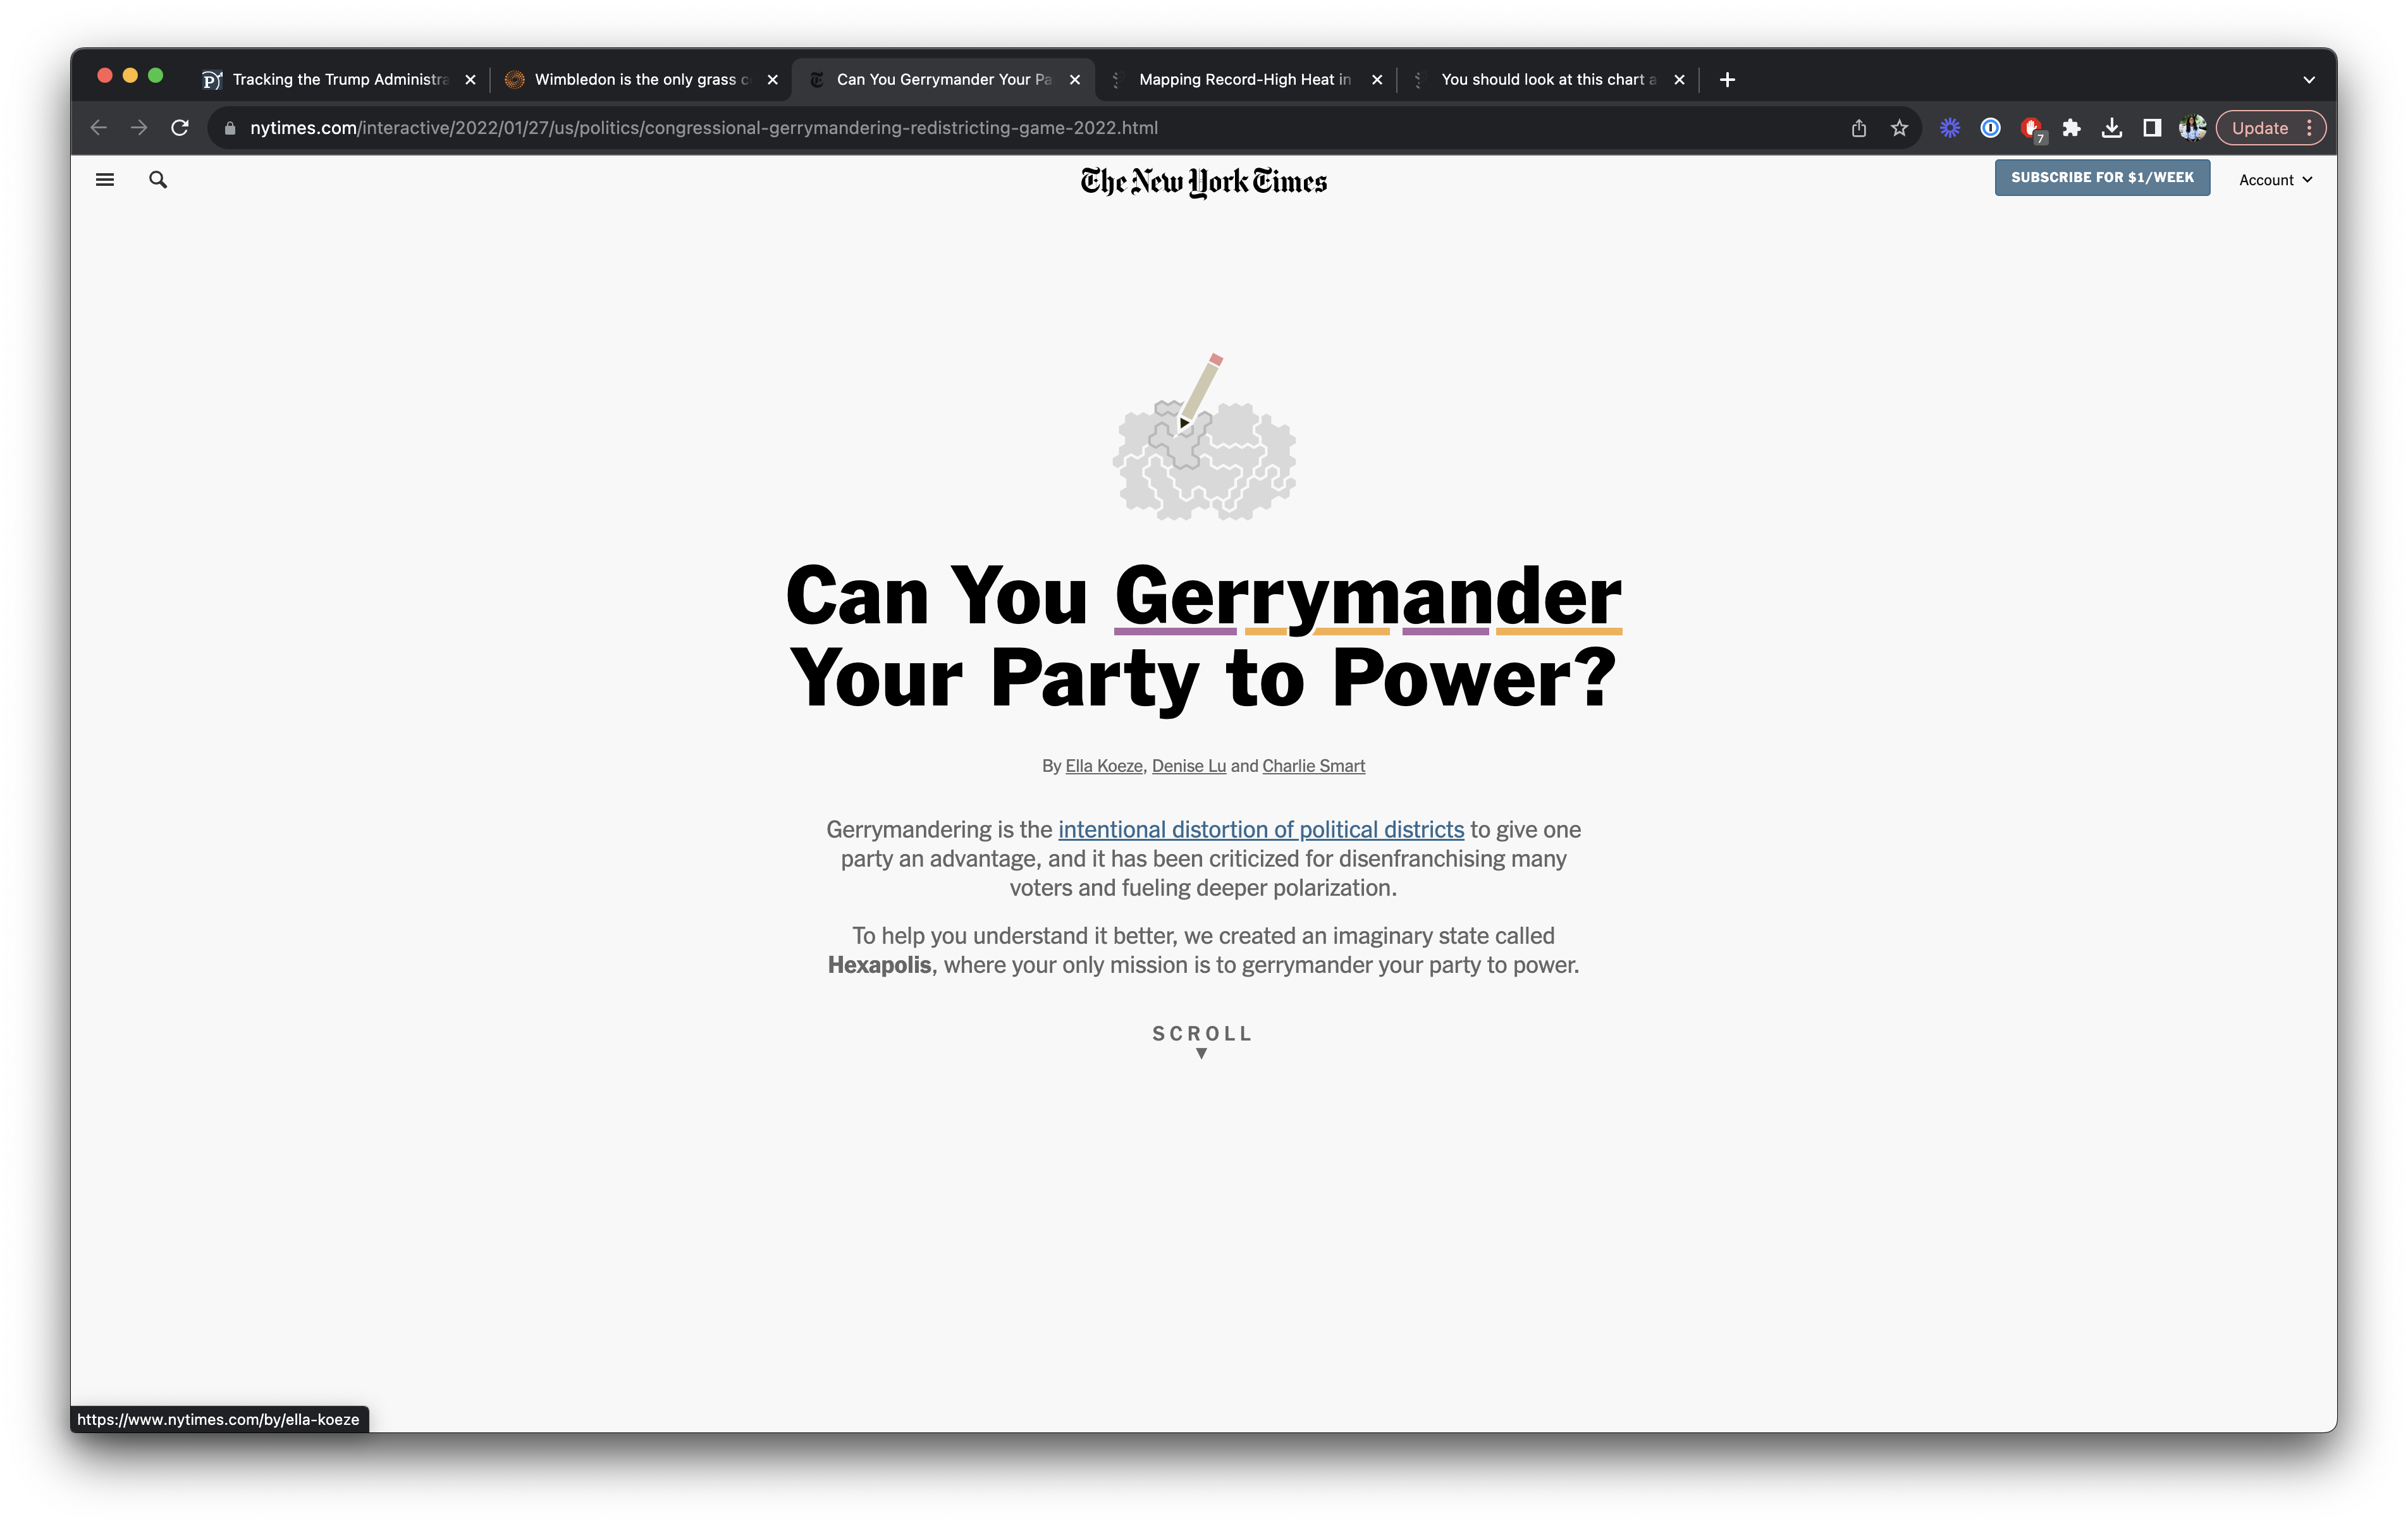
- Lin Lin
You should look at this chart about music genres. | The Pudding
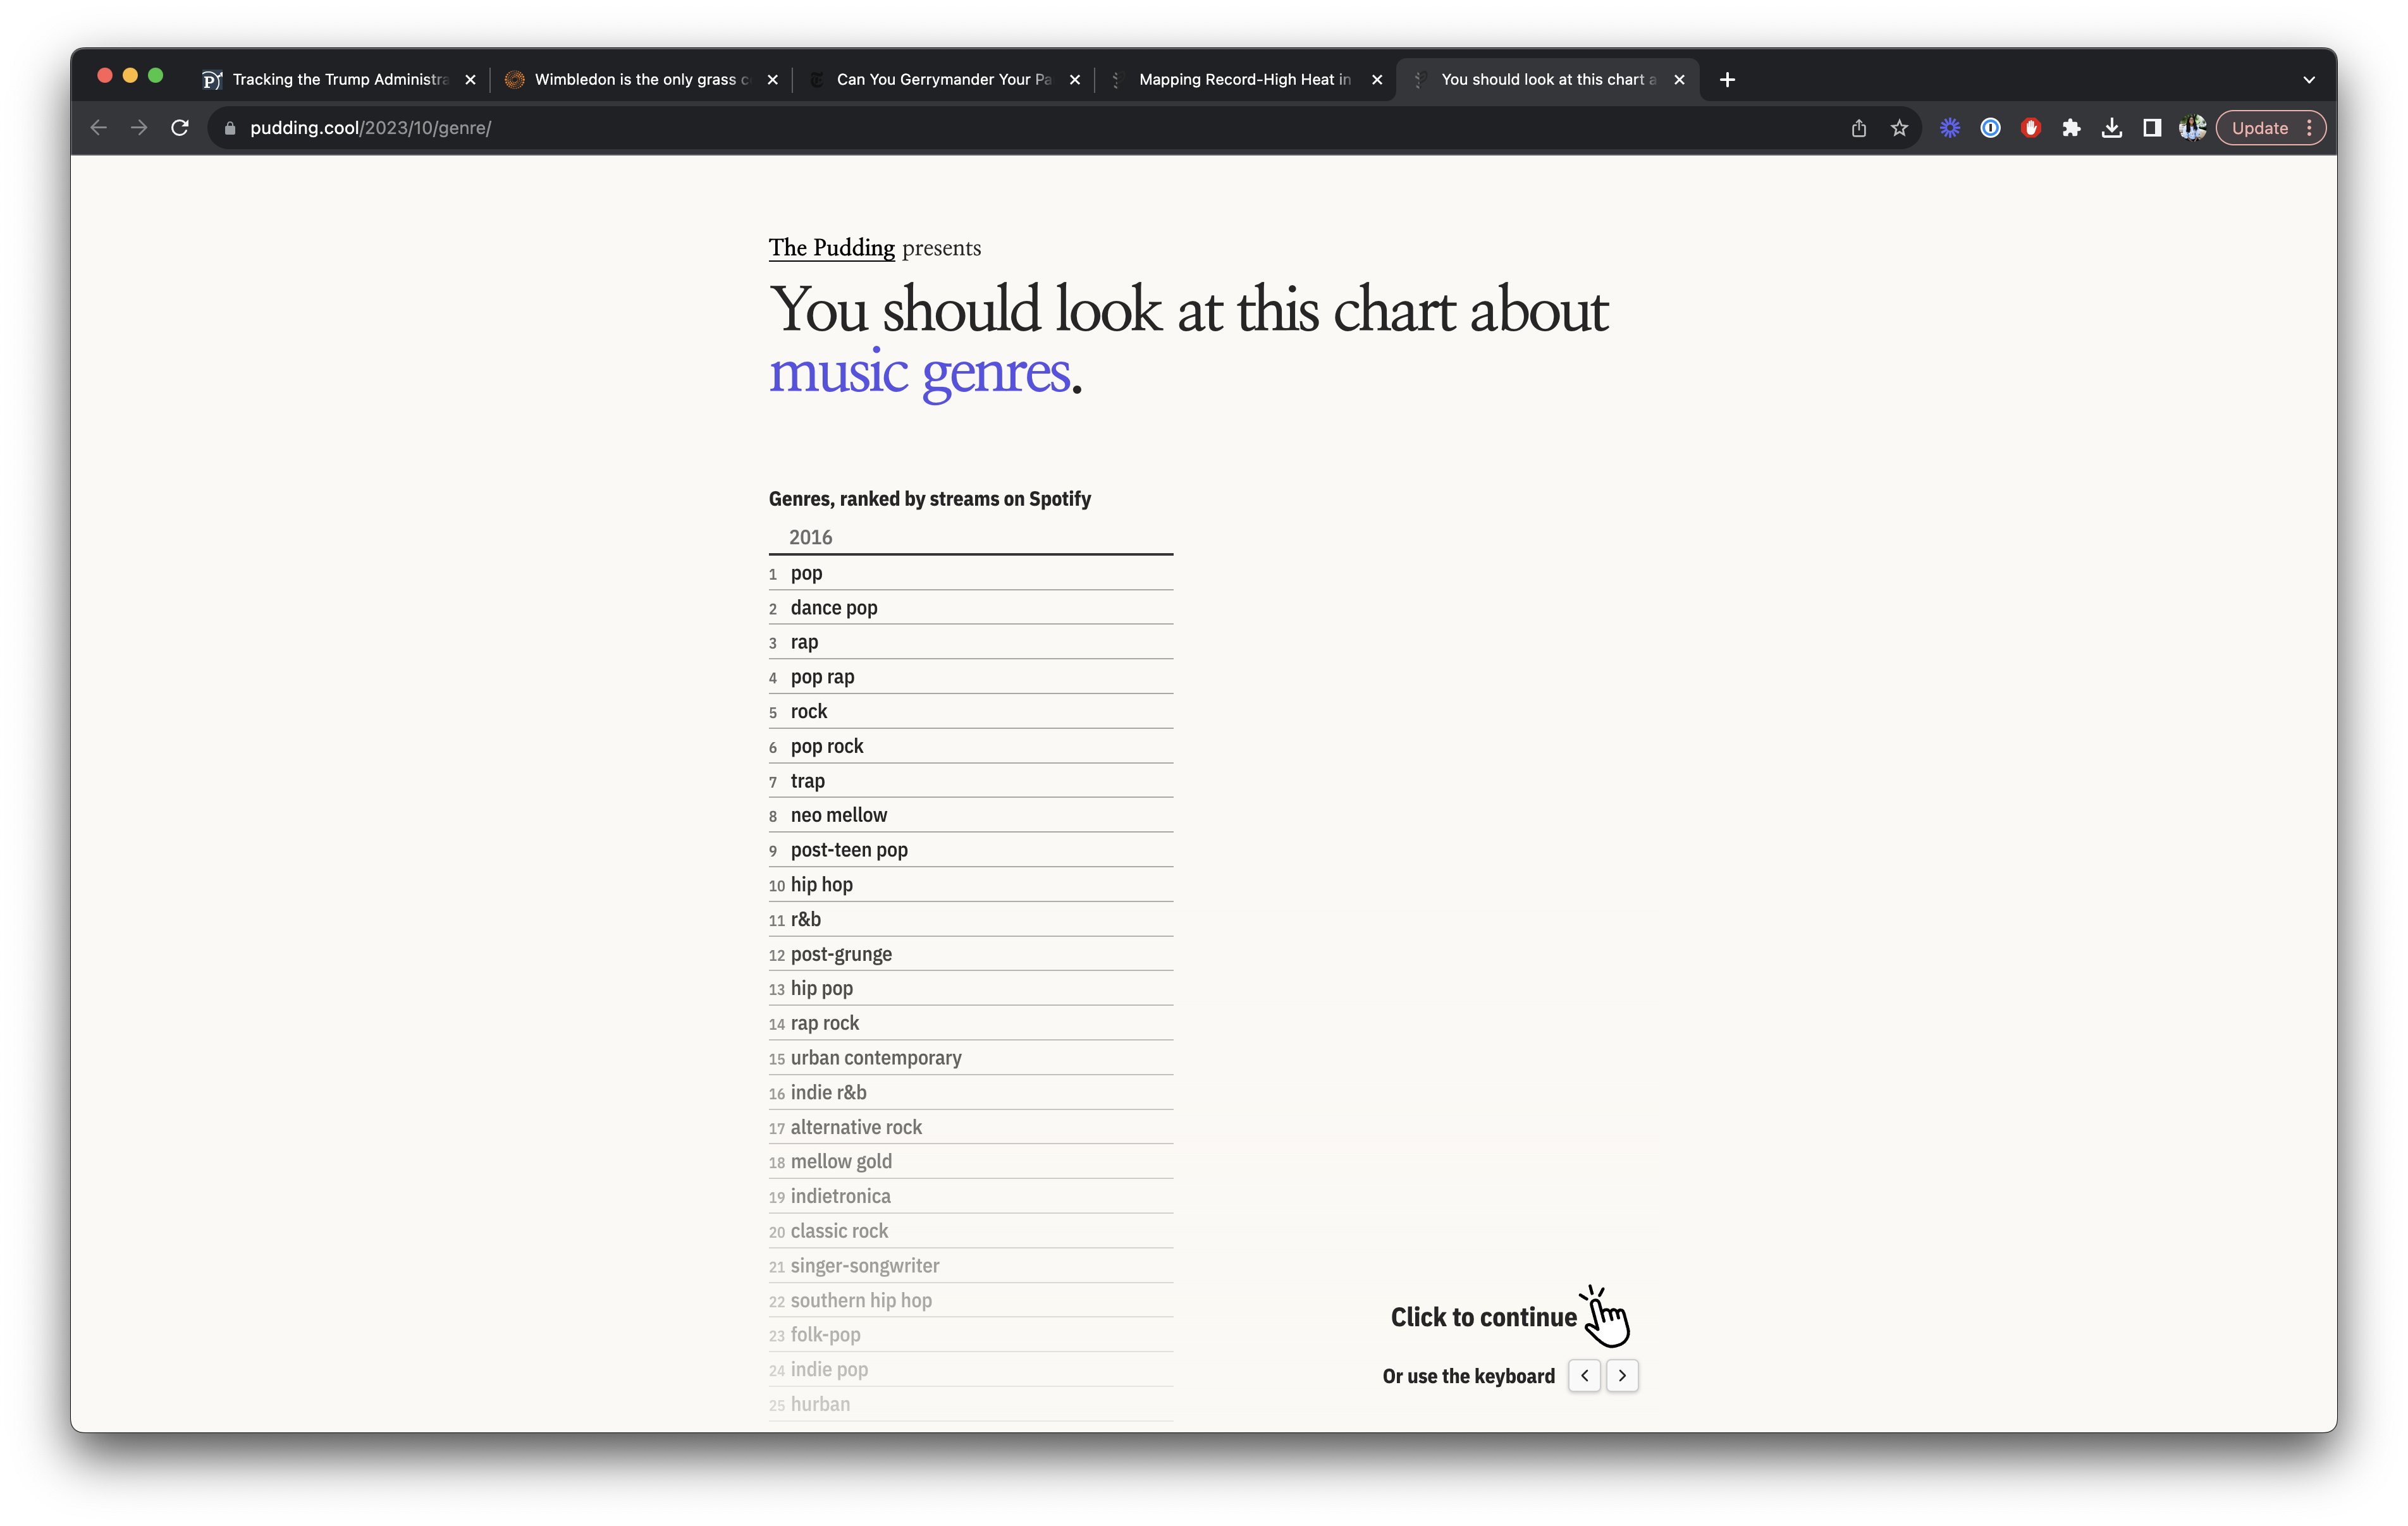
- Kiah
Bar Chart
-
What questions are there? What didn't make sense? What else do you want to try?
Loading...
# Adding interactivity
Click events
One common type of interaction with a webpage is a click. We can perform certain actions as soon as a click happens. It's called a "click event".
Goal: Make a button that, when clicked, changes the color of the chart to a new random color.
-
We need something to click. I've added a button to the page. Right now nothing happens when we click it, so let's tell it what to do. We'll print something to the console when the button is clicked.
Loading...
# Zooming out
I've shown you a lot of new things over the last 2 weeks! A quick recap:
- HTML is for structure, CSS is for style, JavaScript is for interactivity.
- Most of the interactive pieces you see in places like The New York Times or Reuters or ProPublica use HTML, CSS, and JavaScript under the hood.
- Coding can be challenging, but some patience and good Googling can help immensely!
- Interactivity can help your stories be more engaging by making the reader a part of it.
🥳
You made it!
Hopefully you now know a little more about coding data visualizations than when you started.
This was just a small sampling of what's out there - if you want to learn more, here are some final resources (also feel free to schedule office hours with me to chat more!)